Learn more about entering your project's bill, consumption, battery and other values in the Inputs section.
When you have finished entering your PVsell project inputs, you can review your project in the Results Tab. Click on the project's "Show Output" tab to review these infographics.

The results tab shows a customer-friendly set of infographics that communicate the key project results, including bill reduction, payback, lifetime cost of solar energy versus the grid value of solar power, the ROI and IRR, and the energy balance. You can also find more charts to explore. Learn more here: What charts are available?
If you've incorporated batteries into your project you'll have a different set of infographics: What charts and infographics apply to cash/finance/batteries only?
This article contains the following definitions:
ROI / IRR / NPV / Payback / LCOE
Payback is a measure of how fast the investment will pay for itself. It is a very unsophisticated financial evaluation metric that only looks at the short-term. Payback isn't a sensible financial evaluation metric for financed projects, as the initial investment for financed projects is typically zero.
From Investopedia: Payback Period
The payback period is the length of time required to recover the cost of an investment. The payback period of a given investment or project is an important determinant of whether to undertake the position or project, as longer payback periods are typically not desirable for investment positions. The payback period ignores the time value of money, unlike other methods of capital budgeting, such as net present value, internal rate of return or discounted cash flow.
The payback period does not concern itself with the time value of money. In fact, the time value of money is completely disregarded in the payback method, which is calculated by counting the number of years it takes to recover the cash invested. If it takes five years for the investment to earn back the costs, the payback period is five years. Some analysts like the payback method for its simplicity. Others like to use it as an additional point of reference in a capital budgeting decision framework.
There are three main variants, described below.
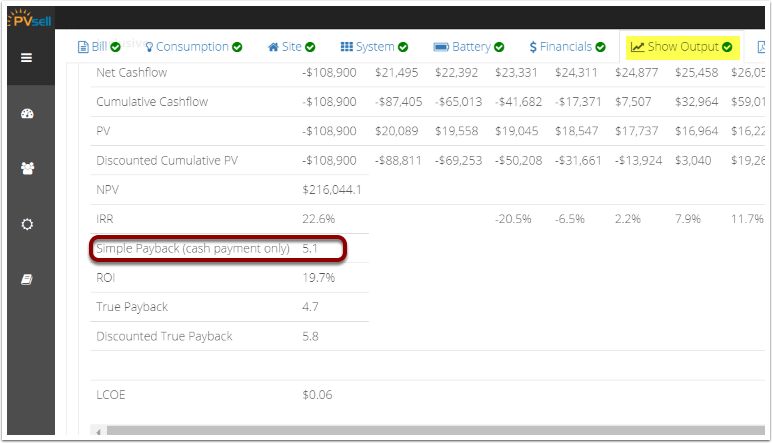
Simple Payback is the simplest financial evaluation metric. It is the division of the upfront costs by the first year savings. The simple payback will be the number of years it takes to repay the initial investment, assuming that the savings remain constant at the same level of the year1 levels. Clearly this assumption is too simple to be true for a solar system facing electricity price rises and panel degradation.
The formula is Simple Payback = Initial Investment / Cashflow in Year 1
You can find the Simple Payback in PVsell here:
- The "Simple Payback" towards the bottom of the cashflow sheet
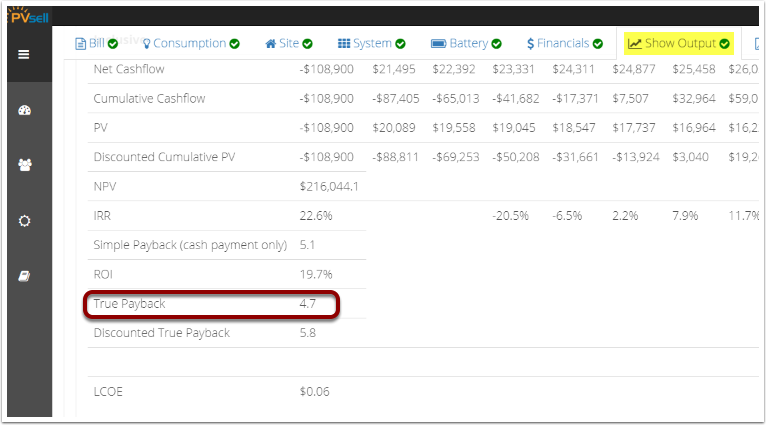
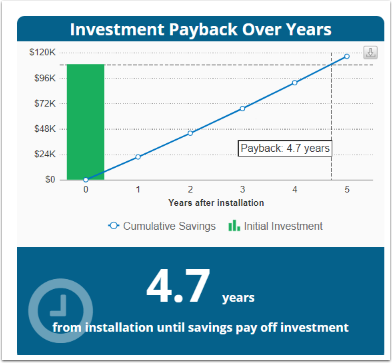
Unlike Simple Payback, True Payback does account for annual cashflows that vary due to electricity price increases and solar panel degradation. As a result True Payback is commonly quicker than Simple Payback.
The True Payback occurs when the initial investment is repaid. More specifically, the true payback occurs the first time the cumulative sum of the costs and benefits of the investment is positive.
You can find the True Payback in PVsell here:
- The "Payback period" merge code
- The "True Payback" line in the cashflow sheet
- The "Investment Payback over Years" Infographic and corresponding Chart
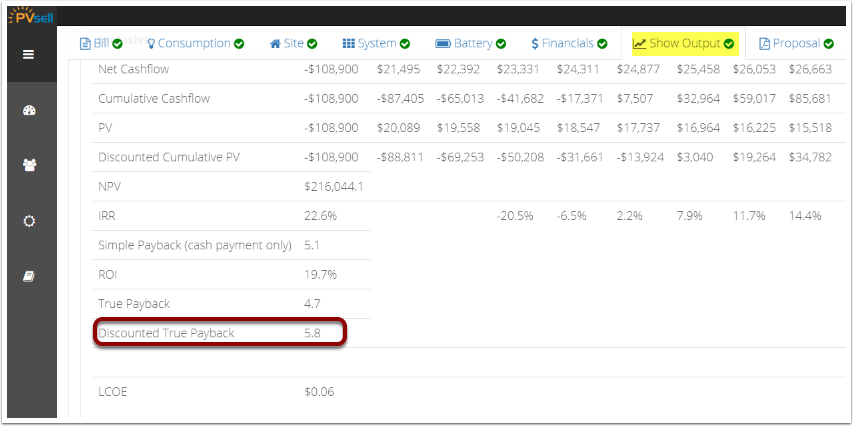
(Note that the discounted True Payback described below does account for the time value of money)
Unlike Simple Payback and True Payback, the Discounted True Payback does account for the Time Value of Money, using a financial discount rate. Because it discounts future revenues, Discounted True Payback is commonly longer than True Payback.
The Discounted True Payback occurs when the initial investment is repaid by the cumulative sum of discounted revenue. More specifically, the discounted true payback occurs the first time the cumulative sum of the present value of costs and present value of benefits is positive.
You can find the Discounted True Payback in PVsell here:
- The last few rows of the cashflow sheet
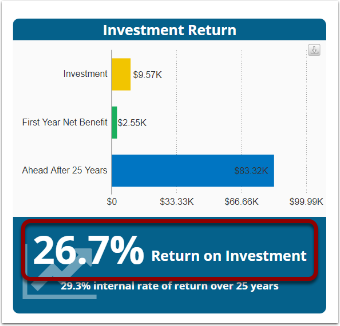
The Return On Investment (ROI) is a calculation of short-term investment performance for your solar project. It compares the initial investment with the first year solar project savings (returns) to calculate a percentage return.
The formula for ROI is: ROI = FIRST YEAR REVENUE / UPFRONT COST. In the image below, for example, the First Year Net Benefit is $2554 and the investment is $9570; hence the ROI is 26.7%
ROI is a well-understood measure of the speed of which the project's investment will 'return' i.e. pay for itself. It is a short-term financial indicator - it does not say how well the project will perform after its paid off, or how well it performs in year 2, or indeed any year other than year 1. ROI is the inverse of simple payback.
When a project is financed, ROI is calculated as the total investment over the life of the system, divided by the first year savings.
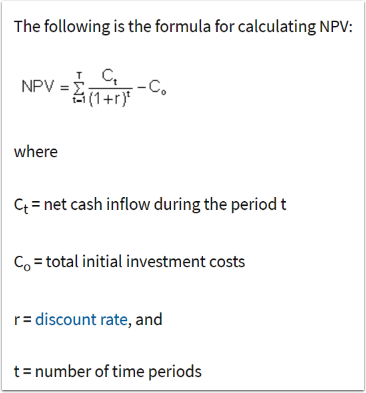
The Net Present Value (NPV) is the difference between the present value of cash inflows and the present value of cash outflows. NPV is a financial term that accounts for the long-term performance of an investment, and expresses it in a dollar figure in today's money. It applies a 'discount rate' to future expenditure and income, in order to express future expenditure in today's money. In this way, NPV accounts for the 'time value of money' - the preference most people have to being given $1000 today versus $1050 in one years time (a 5% discount rate), versus a preference to be given $1500 in one years time versus $1000 today (a 50% discount rate).
Consider NPV like this: if you added up all the benefits from the solar system, and then subtracted all of the investment into the solar system, then you would have the Net Value. By accounting for the 'time value of money' through the discount rate, you can discount future costs and income, and then sum these discounted values.
If the NPV is positive, then the project is financially viable - as it meets the investment hurdle set by the discount rate.
While you can compare the NPV from two projects with equivalent investment amounts, it isn't really possible to compare the NPV of projects with different capital investments (to do this you need IRR). With NPV you are really just looking at whether the value is positive or negative.
From Investopedia: Net Present Value (NPV)
Determining the value of a project is challenging because there are different ways to measure the value of future cash flows. Because of the time value of money (TVM), money in the present is worth more than the same amount in the future. This is both because of earnings that could potentially be made using the money during the intervening time and because of inflation. In other words, a dollar earned in the future won’t be worth as much as one earned in the present.
The discount rate element of the NPV formula is a way to account for this. Companies may often have different ways of identifying the discount rate. Common methods for determining the discount rate include using the expected return of other investment choices with a similar level of risk (rates of return investors will expect), or the costs associated with borrowing money needed to finance the project.
A positive net present value indicates that the projected earnings generated by a project or investment (in present dollars) exceeds the anticipated costs (also in present dollars). Generally, an investment with a positive NPV will be a profitable one and one with a negative NPV will result in a net loss
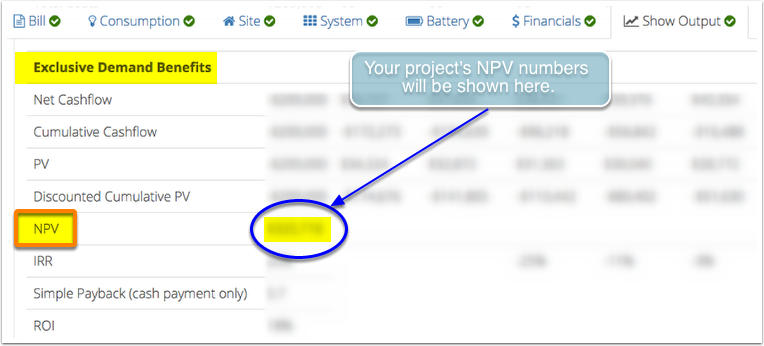
You can the NPV by opening the "Cashflow" sub-tab next to the "Graphs" sub-tab. The NPV data will be shown in the "Exclusive Demand Benefits" section of the "Cashflow" tab. How can I view the cashflow?
You may also want to download the cashflow outputs to your computer. How can I download the cashflow sheet?
The Internal Rate of Return (IRR) is a calculation of the long-term investment performance for your solar project. It gives the total returns value over the lifetime of the project as compared to the costs involved with the system and places a percentage IRR value. It is an long-term financial evaluation measure that is commonly used amongst sophisticated investors in projects with an initial capital outlay followed by many years of financial return. IRR helps you compare investments - e.g. leaving your money in the bank, versus investing it in a solar power system.
The formula for IRR is the discount rate for which the Net Present Value (NPV) of the project is zero.
Huh? Doesn't make sense to you? You're not alone!
An easier way of considering IRR is like a "comparison rate" on a loan you may give, or an investment you may make. For example, you may "invest" your money in the bank and earn a few percent interest, or invest the same money in solar power and achieve potentially greater "interest", albeit with greater risk. The higher the IRR, the more profitable the project.
IRR isn't a sensible measure when financing a project, if the project is cashflow-positive in every year - in this case you're not really 'net' investing any of your own money in any given year, hence the IRR is infinite.
From Investopedia: Internal Rate Of Return - IRR
Generally speaking, the higher a project's internal rate of return, the more desirable it is to undertake the project. IRR is uniform for investments of varying types and, as such, IRR can be used to rank multiple prospective projects a firm is considering on a relatively even basis. Assuming the costs of investment are equal among the various projects, the project with the highest IRR would probably be considered the best and undertaken first.
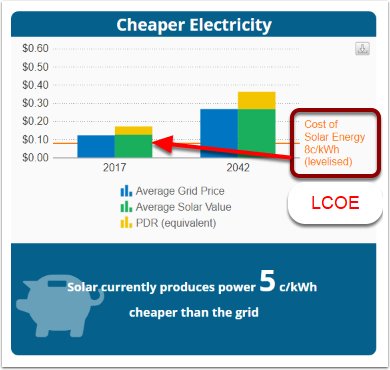
The Levelised Cost of Energy (LCOE) is the cost of the energy produced by the solar system over its lifetime, levelised. The levelisation process is like an averaging process that accounts for the "time value of money" and the "time value of energy", to favour projects that defer their costs, and projects that produce more energy towards the start of their life. It uses the discount rate.
Note that this discounting process produces values that are higher than if you just sum the costs of the system and divide by the energy production of the system without applying a discount rate to future costs and future production.
From Wikipedia:
The levelized cost of electricity (LCOE) is a measure of a power source which attempts to compare different methods of electricity generation on a consistent basis. It is an economic assessment of the average total cost to build and operate a power-generating asset over its lifetime divided by the total energy output of the asset over that lifetime. The LCOE can also be regarded as the average minimum cost at which electricity must be sold in order to break-even over the lifetime of the project.

The LCOE is accessible in PVsell:
- At the very bottom of the cashflow sheet in the Output tab
- Using the "Levelized cost of grid power" merge code
- In the "Cheaper Electricity" Infographic, and corresponding chart.
From Investopedia" Discount Rate
The discount rate also refers to the interest rate used in discounted cash flow (DCF) analysis to determine the present value of future cash flows. The discount rate in DCF analysis takes into account not just the time value of money, but also the risk or uncertainty of future cash flows; the greater the uncertainty of future cash flows, the higher the discount rate
A simple explanation of the discount rate used in DCF analysis is as follows. Let's say you expect $1,000 in one year. To determine the present value of this $1,000 (what it is worth to you today), you would need to discount it by a particular interest rate. Assuming a discount rate of 10%, the $1,000 in a year's time would be equivalent to $909.09 to you today (1,000 / [1.00 + 0.10]). If you expect to receive the $1,000 in two years, its present value would be $826.45.
What is the appropriate discount rate to use for a project? Many companies use their weighted average cost of capital (WACC) if the project's risk profile is similar to that of the company.
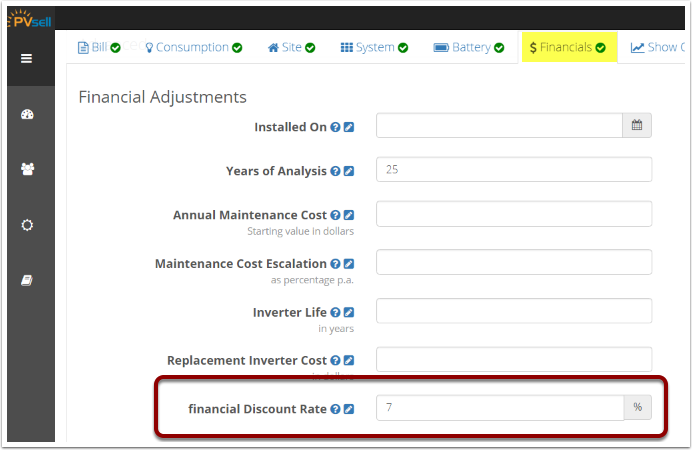
You can set the discount rate used by a project in the advanced section of the financials tab of the project inputs.

1 Comments