This article will focus on the editing options we offer for editable consumption profiles. You can either create a new consumption profile or open a consumption profile from the library and edit the already existing trading/non-trading data.
Your customers consumption will vary depending on volumes of usage and seasonal (as well as daily) variations in energy use. Therefore - using a reflective consumption profile for your OpenSolar analysis is the key for successful financial modelling.
1. Open a consumption profile from the library or create a new one
Simply open an existing consumption profile or create a new one from scratch.
2. Click Edit to jump in edit mode
This way you open the editing screen for the consumption profile - if you created a new profile you end up in the editing screen automatically.
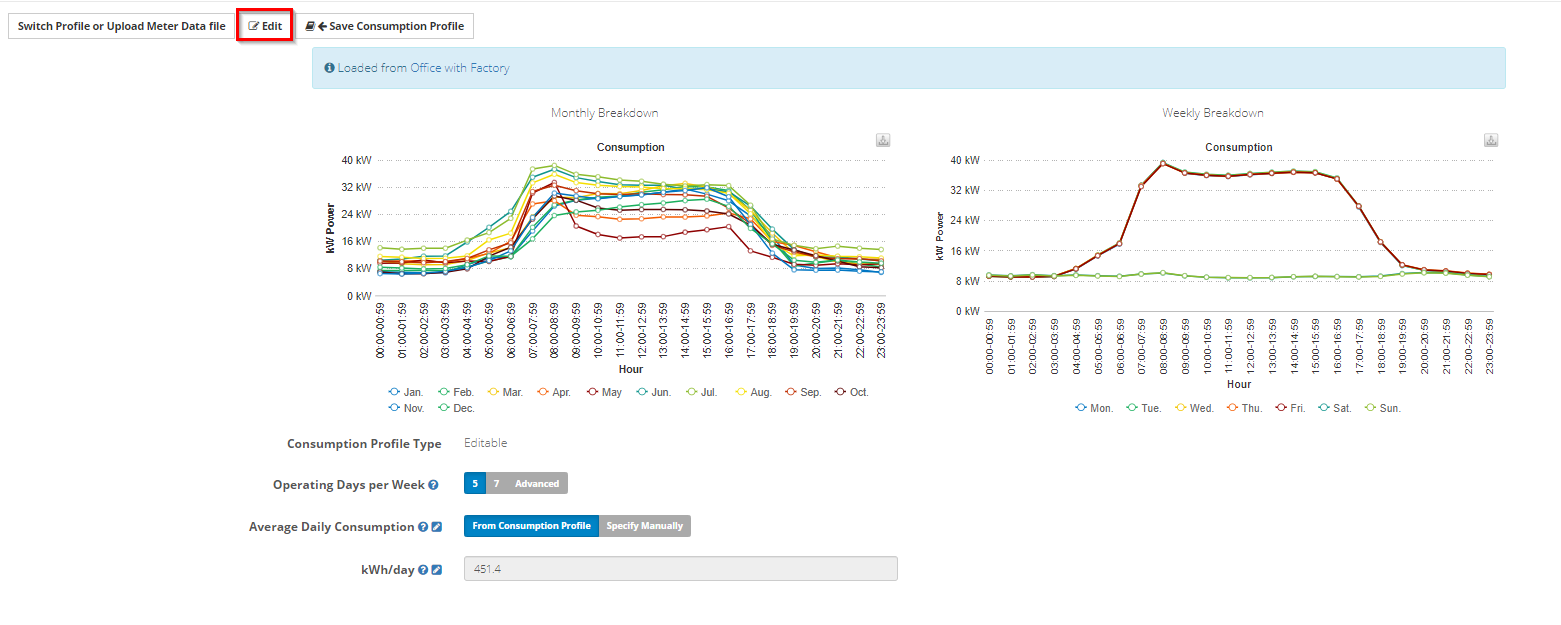
3. In the 'Edit Consumption Profile' window, select 'Editable' for the Consumption Profile Type

4. Edit the data
You have different methods to edit your consumption profile.
Remember that you need to edit the data for trading days separately from non-trading days. You can select which type of days you wish to edit in the table below from either 'trading' or 'non-trading'.

EDITING METHODS
Choose any of the editing methods convenient for you.

Note:
While creating a consumption profile - you don't have to pay attention to enter the exact consumption of your customer in here. It's much more important to define the accurate shape of the consumption profile through the day & the year. You can scale your consumption profile (simply enter the average daily consumption) while using it - see:
4.1. Web Edit
- edit individual data points,
- copy and paste values (you can also paste values into this table from Microsoft Excel if you wish)
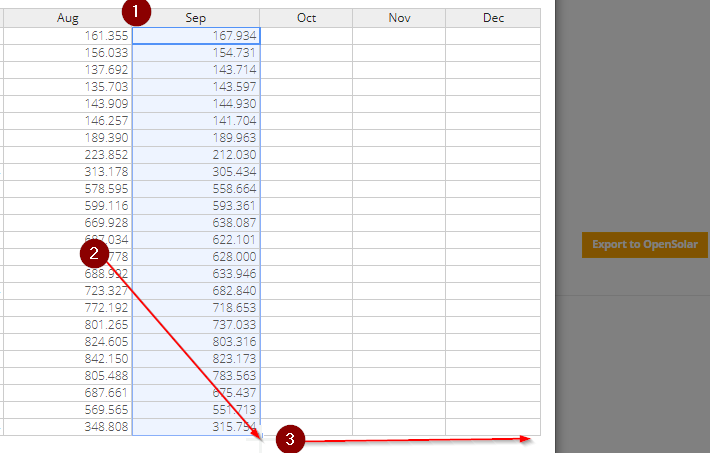
- fill across or fill down (You can extend data by selecting the corner of a selected cell and dragging it across or down)

1. Click on the month which contains data on the very top to highlight the whole column
4.2. Visual Edit
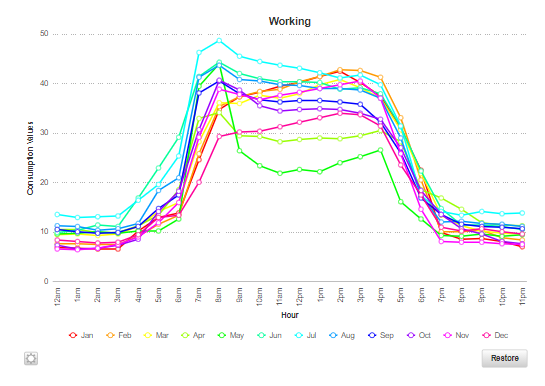
You can perform visual editing of individual data points. Edit the consumption profile by dragging each node to a new value. Also here - pay attention to do it for working and non-working days separately.

If you wish to restore the consumption profile (and cancel the edits you made), you can click Restore on the bottom right hand side of the graph.

4.3. Overwrite with CSV
You can change the editing method to a third option to overwrite the currently loaded consumption profile from your own local .csv file.
Working/Non-working files must be in CSV format with a row of months along the top, and a column with an hour of day on the left. It must be in the same format as the Web Edit tables. You can also click the 'example data file' link preceding the upload sections to see what format these uploads must be in.
Note that the year/hour row/column can be in any format, or be blank, but must exist because they will be removed. Also - the first row of your CSV file must contain column headings.

Upload your .csv consumption file for trading days ('Working File')

Upload your .csv consumption file for non-trading days ('Non Working File')

5. Done! Time to use your updated profile
After editing the trading/non-trading data in the Edit Consumption Profile window, click Save changes.

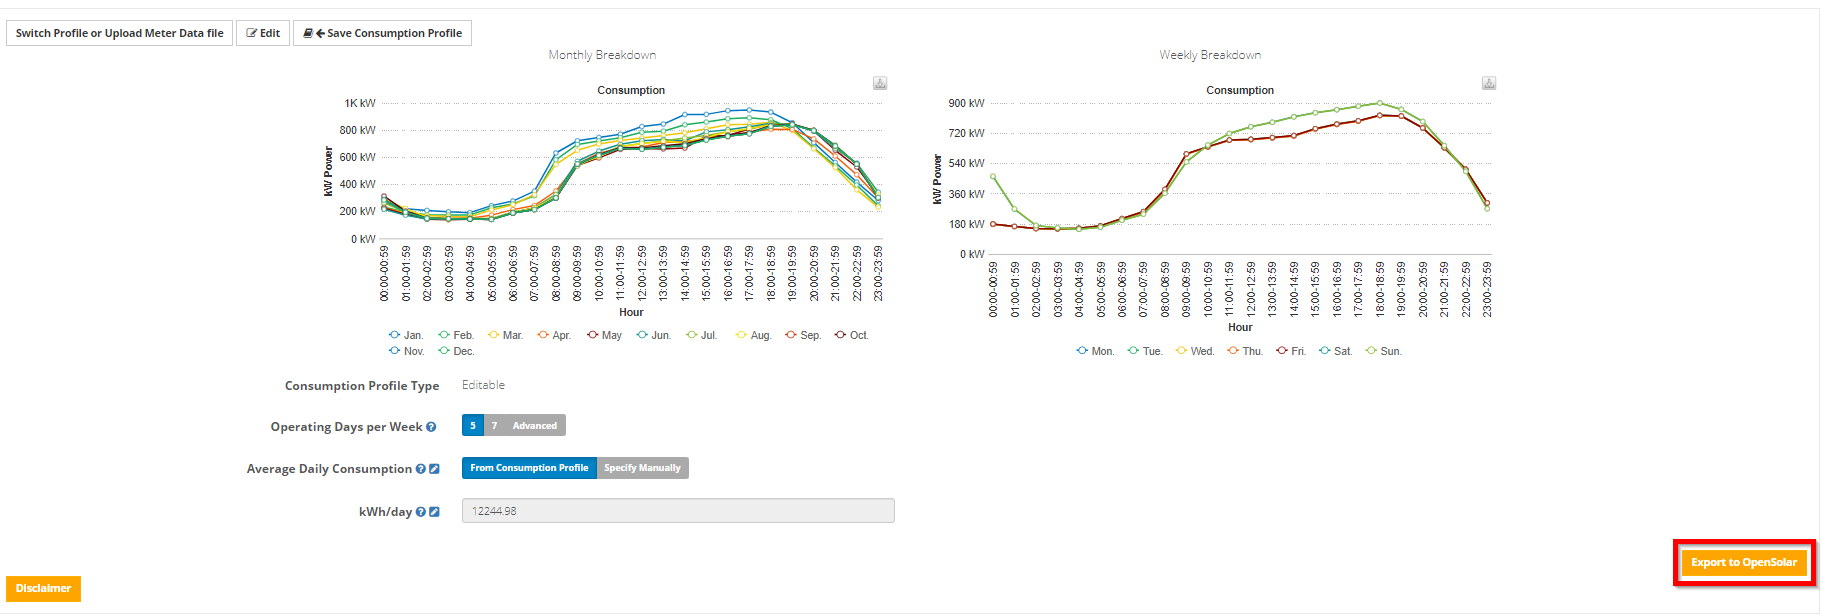
6. Done! Push the data to your OpenSolar project
Just press the Export to OpenSolar button on the bottom right
0 Comments