What to do if you can not access interval meter data from your customer and none of the consumption profiles matches your idea of your customers consumption patterns?
No problem! You can either edit an existing profile from our library or simply create a new profile from scratch. Check out the following article to learn how to edit an existing consumption profile.
This article is focusing on the creation of a new consumption profile from scratch.
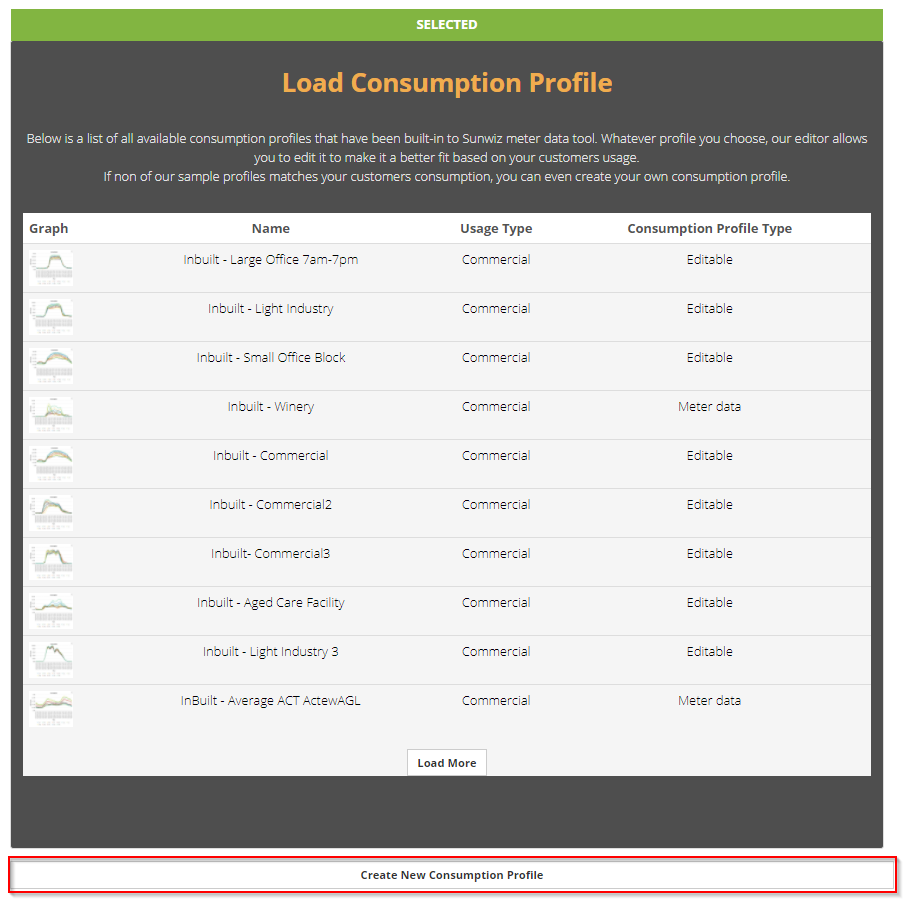
1. Click "Create New Consumption profile"
It's located just below the "Load Consumption profile" pop-up.
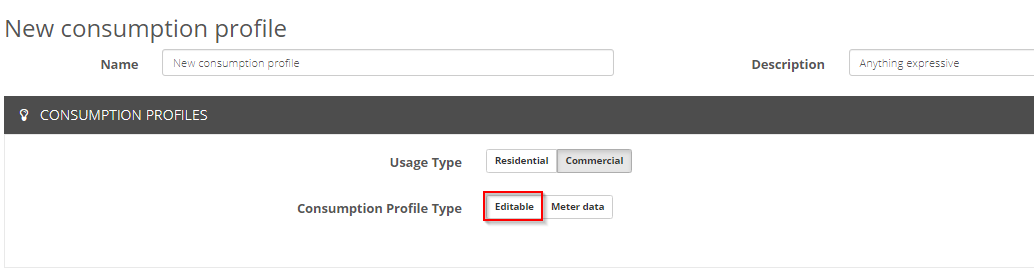
2. Enter "Name", "Description" & "Usage type"
All of these sections are mandatory.

3. Select the type of the consumption profile
In most cases you want to design your own consumption profile without having a meter data file on hand - being able to create & edit it yourself from scratch. If this is the case, select Editable to proceed.
- How to upload a meter data file?
- What's the difference between Editable & Meter data Consumption profile type?
4. Profile Adjustment
If you decided to create your own profile and selected Editable the window expands and further editing options appear.
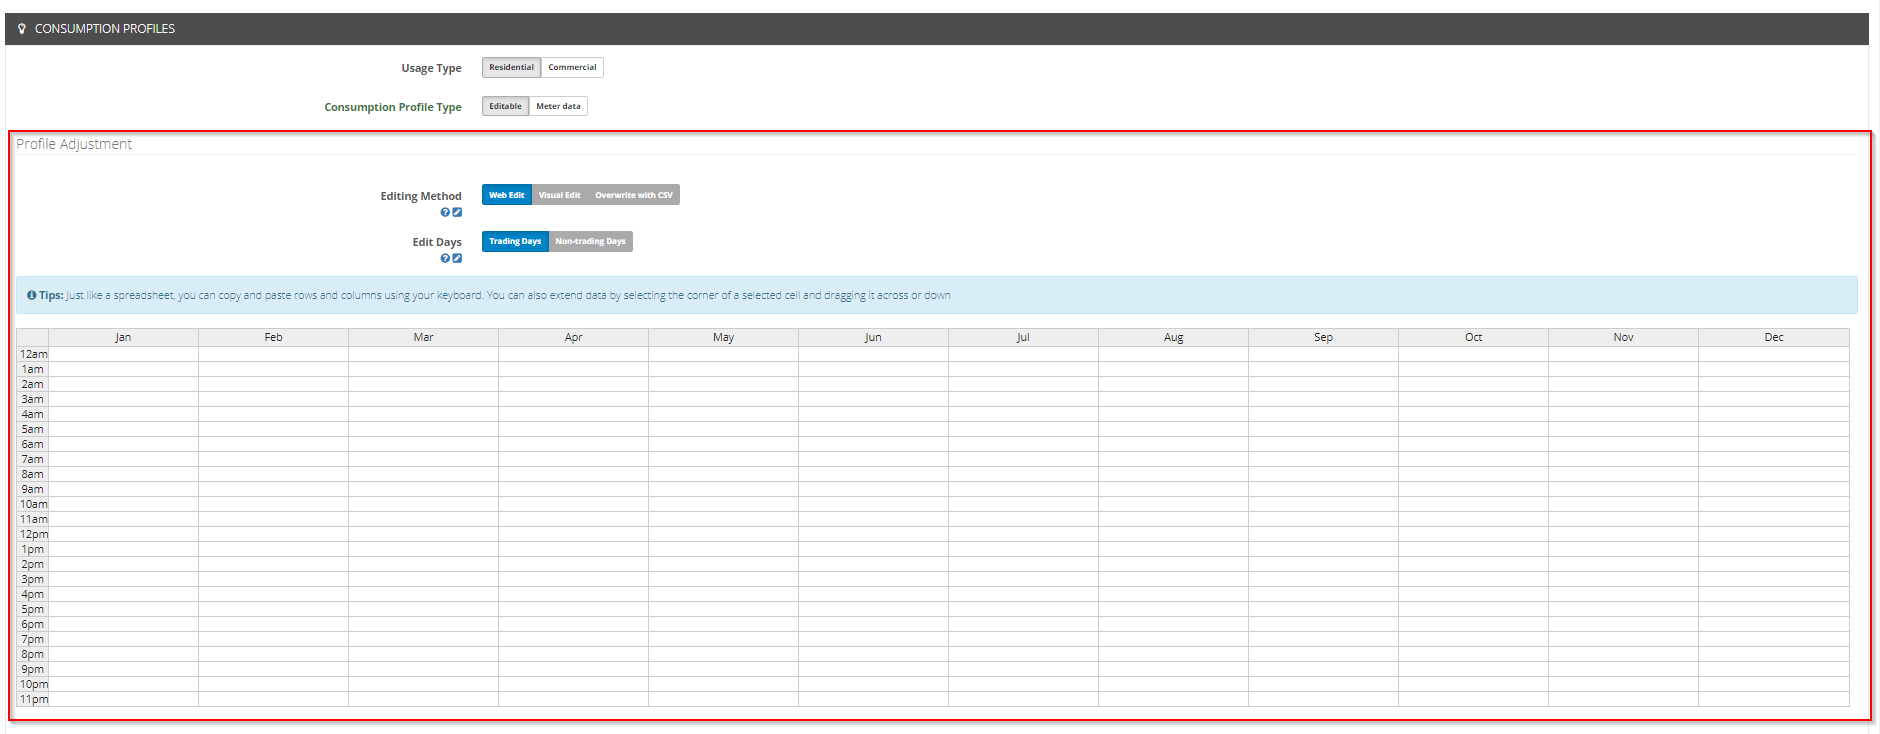
4.1 Editing Methods
Choose your preferred option to edit your consumption profile.
Web edit
You can edit the trading and non-trading information directly in your browser using a spreadsheet-like interface (Web Edit), where you can edit individual data points, or copy and paste values, or even fill across or fill down!
Visual edit
You can use this feature to translate the numeric information from web edit into a graph and visually edit each data point further. Simply drag and drop the profile data points on a graph.
Overwrite with CSV
You can change the editing method to a third option to overwrite the currently loaded consumption profile from your own local .csv file. This allows you to create your web edit like format via excel and upload into our tool.
The following articles describes the different editing methods more detailed:
4.2 Edit days
This feature allows you to create 2 in one profiles. We differentiate between a profile where the business is operating and a profile where the business is closed.
Trading days
Reflect operation days of the business you create/adjust the profile for. Typical trading days are Monday - Friday.
Non-trading days
Reflect days the business is closed. Typically Saturday & Sunday.
Remember that you need to edit the data for trading days separately from non-trading days.
Here you only define the shape of the trading/non-trading days consumption. You'll be able to define the operational days of the business after the profile got created via "Operating days of the business".
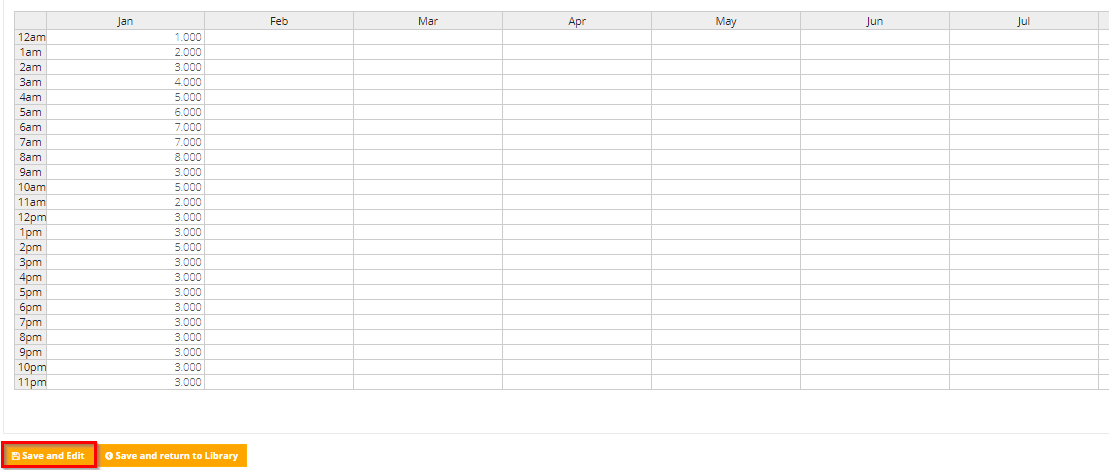
5. Create your own profile and preview your adjustments by pressing Save & Edit
Our recommend editing method is web edit - therefore we've used this editing method for this example.
You can define the consumption patterns for each month separately. Again, don't forget to do that for both - trading & non-trading days. In this example we've only adjusted values for one month for presentation purposes - for each month you can enter 24 data points in kW which reflect 24h of the day.
Note:
While creating a consumption profile - you don't have to pay attention to enter the exact consumption of your customer in here. It's much more important to define the accurate shape of the consumption profile through the day & the year. You can scale your consumption profile (simply enter the average daily consumption) while using it - see:
To many numbers? Feeling like a spreadsheet full of numbers are irritating? Good news! We thought the same - and implemented a preview feature. You have the ability to convert these numbers in a visual consumption graph by pressing Save & Preview.
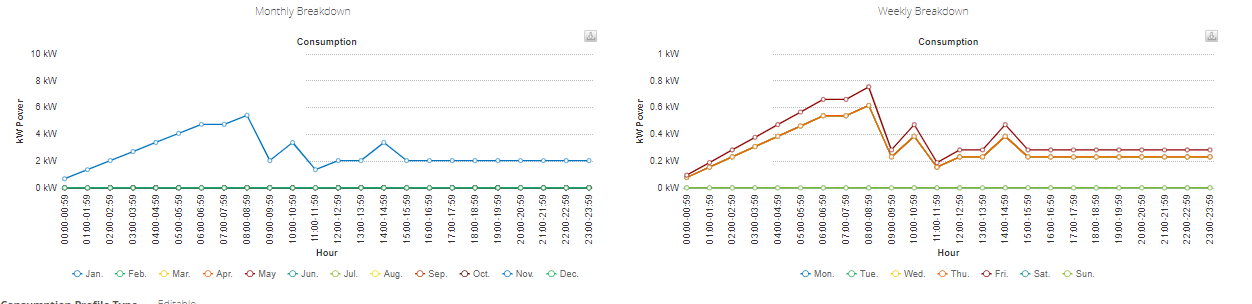
Not what you've expected to see? Just edit the numbers and press Save & Preview to view the graph again.
Monthly Breakdown graph
The upper left graph is showing the breakdown by month. Each month appears in a different color - you can enable or disable a specific month visually in the graph by clicking on the month below the graph.
Weekly breakdown
The graph on the right hand side visualizes the average week of the consumption graph. Monday to Friday visualize trading days - Saturday & Sunday visualize the non-trading days.
The flat lines you see in the graphs above appear as we've only entered data points for January & only for trading days.
6. Done! Time to use your new profile

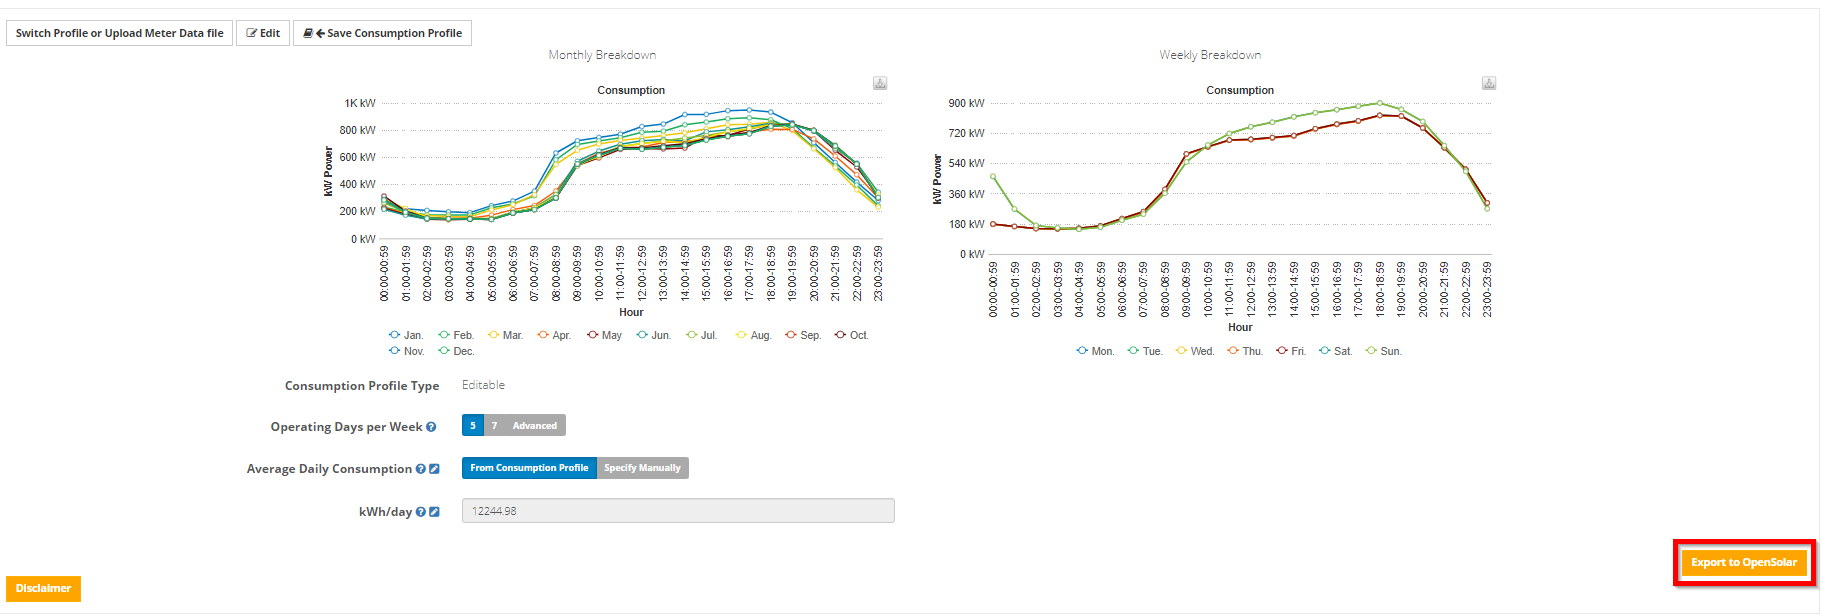
7. Done! Push the data to your OpenSolar project
Just press the Export to OpenSolar button on the bottom right
0 Comments